Key takeaways
One of the ongoing tailwinds for MLP performance is distribution growth. Distribution trends are very important for MLP investors, who often allocate to the space primarily for its income. TodayÃffÃ,¢Ãf¢,Ã,¬Ãf¢"Ã,¢s note looks at distribution trends for the benchmark Alerian MLP Index (AMZ) and compares year-over-year distribution changes with index performance. Spoiler alert: MLPs tend to perform well when distributions are growing.
Understanding index-level distribution growth and recent trends.
VettaFi publishes a detailed recap of midstream dividends each quarter (stay tuned for the 4Q24 update next week). However, it can be helpful to look at changes in payouts over time at the index level through a simplified chart. AMZ is used here as our broadest MLP benchmark, but keep in mind, the Alerian MLP Infrastructure Index (AMZI) is a subset of AMZ.
To be clear, there can be different ways to calculate index distribution changes. The methodology used in the chart below compares what AMZ constituents are paying out on an annualized basis. It compares annual normalized total distributions with the prior year to calculate a percentage change. (Read more on the methodology here.)
Digging into the chart, distribution growth has clearly been strong in recent years. MLPs have historically focused on distribution growth, but trends have improved since an inflection in free cash flow generation that began in 2020/2021. In some cases, MLPs have been growing payouts after painful cuts made in 2020. Since July 2021, there has only been one distribution cut for an AMZ constituent. (USD Partners, which had a very small weight in AMZ at the time, suspended its payout in 1H23.)
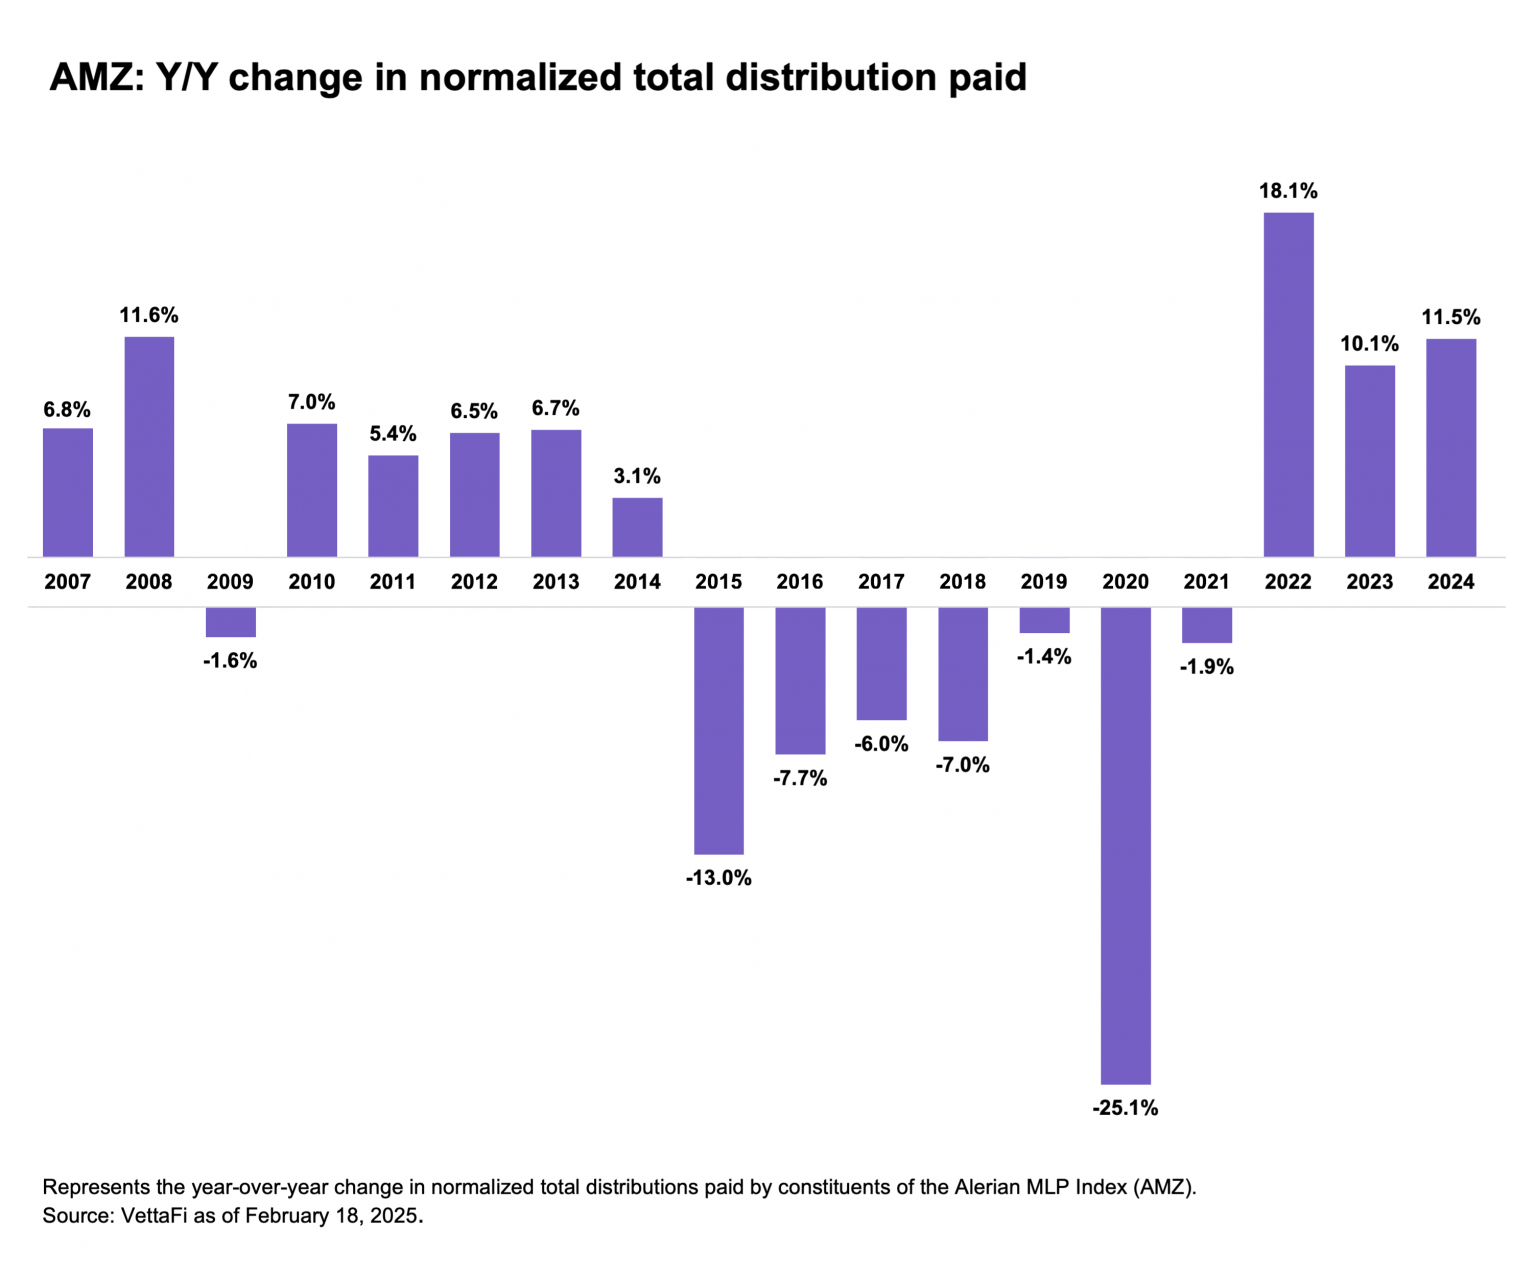
While the data points from 2015 to 2020 are bleak (explained more below), it is important to note that MLPs have improved drastically over the last decade. Highlights include lower leverage and stronger balance sheets, a shift to self-funding equity capital, free cash flow generation, and widespread buyback authorizations instead of equity issuances (read more). Burdensome incentive distribution rights have been largely eliminated. MLPs are much better positioned today than they were during the oil downturn of 2014-16 or during the growth capital spending frenzy of 2018-19.
Why was 2015 to 2020 so bad?
Distribution trends were clearly lackluster from 2015 through the pandemic. Recall, energy was broadly under pressure from 2H14 until oil prices bottomed in February 2016 at $26 per barrel as OPEC fought U.S. shale for market share. While oil and gas producer MLPs are not currently eligible for AMZ, there were seven producer MLPs in AMZ at the end of 2014. Those names were quick to cut their payouts when oil prices fell. As their equities plummeted, they became ineligible for the index. There were no upstream MLPs in AMZ by late 2017.
Even in 2015, the vast majority of AMZ constituents were increasing or maintaining their payouts. For AMZ, cuts had an outsized impact as high-yielding producer MLPs were replaced by MLPs with lower yields. For context, normalized distributions for AMZI, which has never included producer MLPs, were only down 5.9% in 2015. Some larger MLPs cut their payouts in 2016 and 2017, but the impact on distributions was less pronounced because they were not replaced with lower-yielding names. Importantly, Enterprise Products Partners (EPD) and MPLX (MPLX) are examples of MLPs that have never cut their distributions.
Fast-forwarding to the pandemic, 16 AMZ constituents cut their payouts for the first quarter of 2020 (read more). Prior to this, the largest number of distribution cuts in a single quarter had been five. This helps explain the drastic drop in normalized total distributions shown above. In 2020, cuts generally came from names focused on gathering and processing or petroleum transportation with elevated leverage and below-average distribution coverage. These were largely small-cap names that were trying to shore up their balance sheets in an unprecedented energy macro backdrop.
Performance has been strongly tied to distribution trends.
Generally, MLPs tend to perform well when distributions are growing, but distribution cuts weigh on performance. The chart below plots year-over-year distribution changes since 2007 from the bar chart above with the annual price return of AMZ. When distributions are growing, price returns tend to be positive or nearly flat as highlighted in the top right quadrant. The Global Financial Crisis in 2008 marks the only exception (i.e., significant distribution growth with very weak performance), as shown in the lower right quadrant.
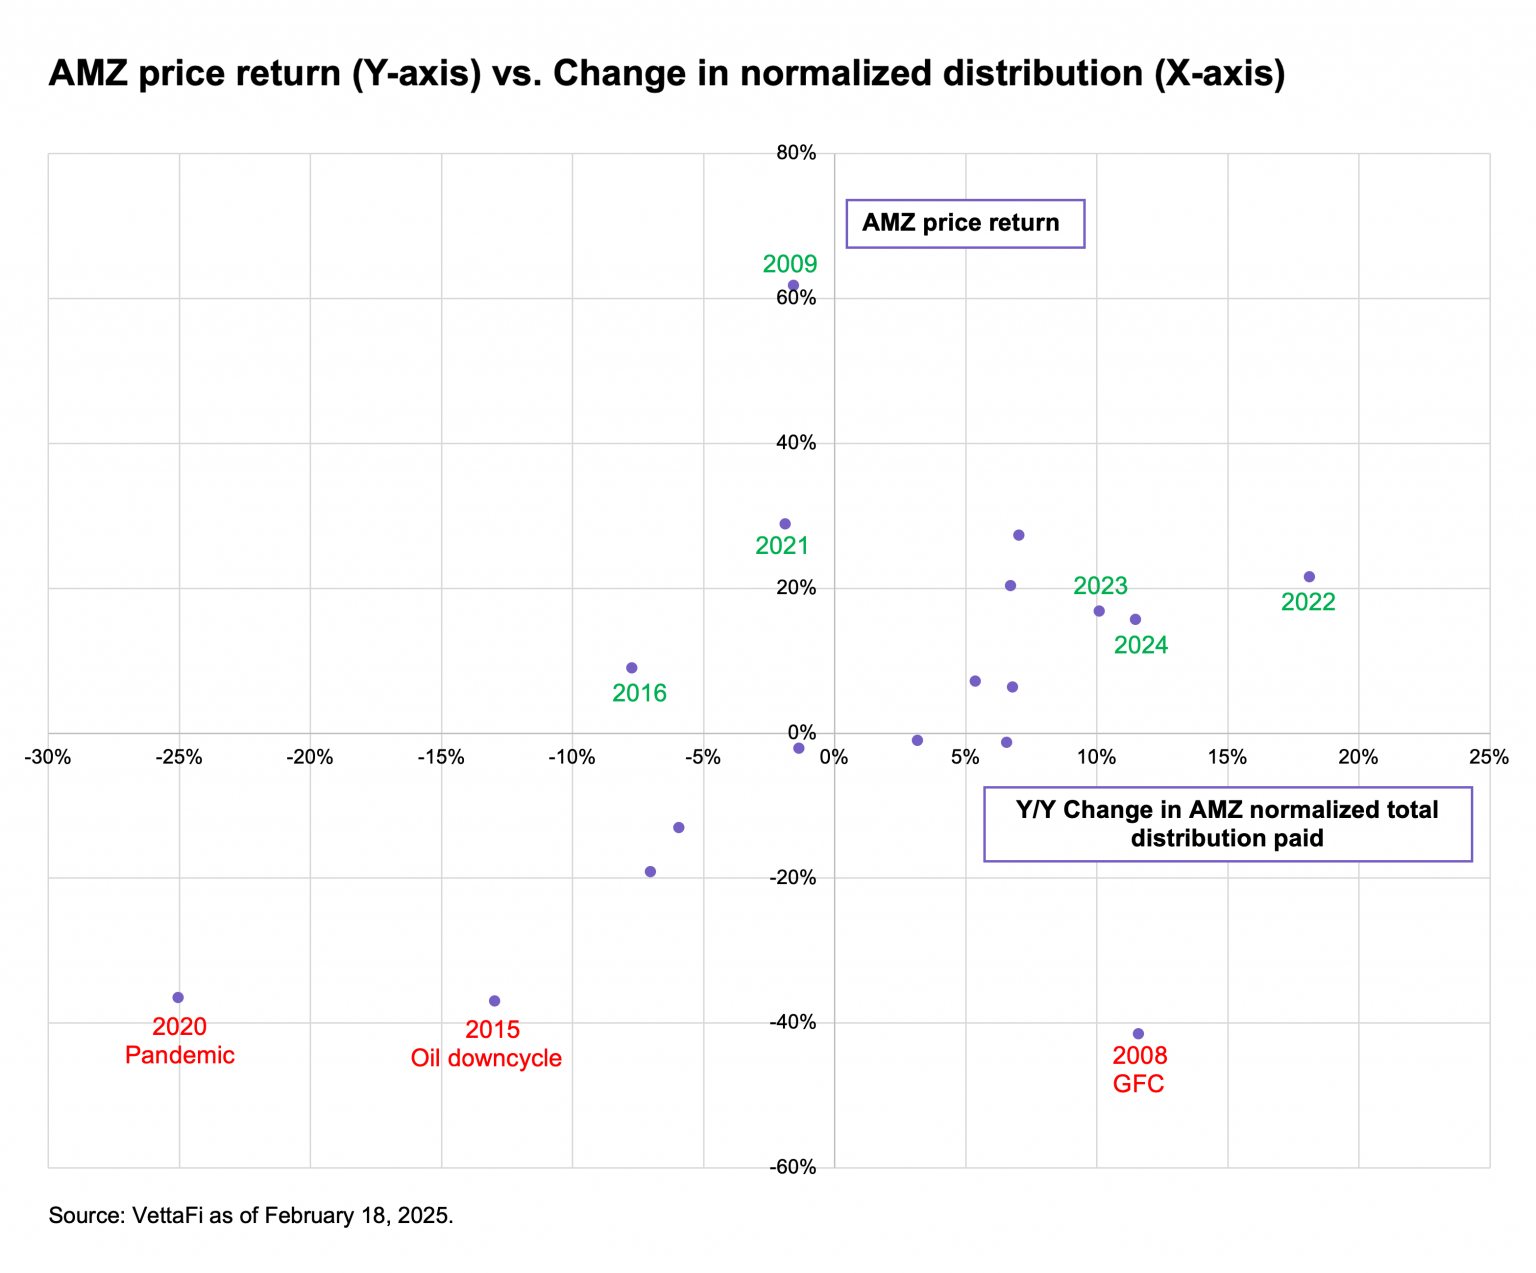
Typically, negative price performance coincided with lower distributions as cuts weighed on equity prices. This is particularly exemplified by 2015 and 2020, when the impact of distribution cuts was most pronounced, and AMZ performance was particularly weak. These examples are shown in the lower left quadrant.
There have been a few occasions since 2007 when AMZ saw positive price returns amid declining distributions. This was the case in 2009, 2016, and 2021, as shown in the upper left quadrant. In short, the index was rebounding after painful 35%+ price declines seen in 2008, 2015, and 2020.
Related: Why most MLP ETFs own less than 25% MLP
So what?
Investors often ask if the positive momentum in the MLP space can continue. Arguably, investors can likely feel good about future MLP performance if they expect distributions to continue growing. We believe the outlook for MLP distribution growth remains positive, as companies largely generate free cash flow and prioritize distribution growth. Additionally, companies are in a stronger financial position today given lower leverage, better balance sheets, and greater financial flexibility.
Of course, past performance does not guarantee future results. Looking at distribution trends alone as an indicator of MLP performance is admittedly oversimplifying. However, in the absence of a crystal ball, the outlook for distributions can provide helpful context for expected MLP performance.
AMZ is the underlying index for the JPMCFC Alerian MLP Index ETN (AMJB), the ETRACS Alerian MLP Index ETN Series B (AMUB), and the ETRACS Quarterly Pay 1.5x Leveraged Alerian MLP Index ETN (MLPR). AMZI is the underlying index for the Alerian MLP ETF (AMLP) and the ETRACS Alerian MLP Infrastructure Index ETN Series B (MLPB).
This article was originally published February 25, 2025 on ETF Trends.


